Have you ever worked with a database using filters and want to know the sum of that filtered data in Excel? To do this, if you’ve used the “Sum” function, you’ll have noticed that the result is the sum of all the data (including data not included in the filter). This article proposes a function to solve this problem.
Summing filtered data in Excel
Let’s start with the data table below. The total of all values is 1.248. It was obtained using the “Sum” function.

Now, if you add a filter and choose only units A and B for 2010. Take a look at the result of the sum. It didn’t move! The “Sum” function always sums lines 7 to 29, regardless of the filter.

 Vous aimeriez créer des états financiers prévisionnels complets et dynamiques dans Excel, capables de se moduler à vos hypothèses, afin d’éclairer vos décisions d’affaires ? Apprenez les meilleures pratiques avec nos formations en modélisation financière.
 |
|---|
To solve this problem, use the “Subtotal” function instead, as shown in the image below.

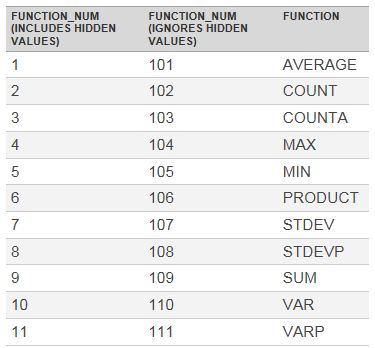
What does the 9 in the previous function mean? The 9, as you can see in the table below, is linked to the “Sum” function. You can use the “Subtotal” function with other operations: average, count, max, min, etc.
Further training
Are you as good at Excel as you think you are? Take the test! You can then follow the Excel – Upgrade which can serve as a warmup for professionals who already use Excel in their jobs and want to go further, and is also a recommended prerequisite for the Excel – Dashboards (level 1), Excel O365 – Welcome to the modern age! and above all, Excel – Financial modeling (Level 1).
Here are a few comments from learners who have taken the Excel – Mise à niveau course:

 La mission du CFO masqué est de développer les compétences techniques des analystes et des contrôleurs de gestion en informatique décisionnelle avec Excel et Power BI et favoriser l’atteinte de leur plein potentiel, en stimulant leur autonomie, leur curiosité, leur raisonnement logique, leur esprit critique et leur créativité.