Acheter des sièges supplémentaires pour cette formation
Course outline last update: 2024-02-09
This online training course lasts approximately 6 hours (3 hours of video and about 3 hours of exercises).
To access the course, click on "Buy this course" to add it to your shopping cart. Then proceed to checkout to complete the transaction. If payment is made by credit card, the course will be available immediately. If payment is made by bank transfer, the course will be available as soon as we have received and processed the payment.
This training is available in asynchronous online format directly on our web platform. The training will be supported by alternating video clips and exercises.
An entry evaluation will be carried out at the start of the course. A final assessment after each training module will validate the achievement of pedagogical objectives. The pass mark is 75 %.
The average score for learners who have completed the course is 88.8 %.
Please let us know if you have any specific requirements. If we can't meet them, we'll refer you to the organizations that can help you, and we'll take their recommendations into account wherever possible.
If you have any questions about this training course, please contact us at [email protected]

Audrée Pellerin is a passionate professional, holding a master's and bachelor's degree in Corporate Finance from the University of Sherbrooke. With several years of experience in the field of consulting services, she has worked with SMEs, multinational corporations, and public sector organizations. Audrée stands out with her dual expertise as a business intelligence consultant and experienced trainer. She possesses a natural talent for explaining complex concepts in a clear and accessible manner and is recognized for her ability to impart knowledge with patience and professionalism.
As a trainer, Audrée plays a vital role in helping companies strengthen the skills of their internal teams. She develops customized training programs tailored to the needs of her clients and guides participants through interactive and engaging sessions. Her pedagogical approach promotes active learning and the practical application of acquired knowledge.
Trainer accredited by the Commission des partenaires du marché du travail. At the end of this training, when all the lessons and quizzes are completed, the learner will be able to download a certificate of completion. This certificate will include the trainer's Emploi-Québec accreditation number, the participant's name, the title and date of the training, the number of hours of training completed, the number of Continuing Education Units (CEUs), as well as the name and signature of the trainer. This certificate meets the requirements of the continuing education obligations of the Quebec professional orders. For private training (via Teams), the certificate will be sent to the learner by email following the completion of the training.
 Le CFO masqué is a member of the Société de formation et d’éducation continue (SOFEDUC), which defines a Continuing Education Unit (CEU) as 10 hours of participation in a structured training activity organized and conducted by an accredited organization, facilitated by qualified instructors and culminating in an evaluation. Only SOFEDUC members in good standing are authorized to use the graphic symbol.
Now that you've explored Power BI report consulting, would you like to create your own reports? If so, the next course to take is: Power BI (level 1)
This beginner Power BI training course is for the professionals who have a lot of data to analyze and who are looking for a self-service BI solution (Business Intelligence).
You might also like to take a look at our Excel training courses.
No refunds allowed since you have access to your training material from the moment of payment.

 Dino Vincent Sacchetti
Écrit il y a 2 ans
Dino Vincent Sacchetti
Écrit il y a 2 ans
 Mauricio Contri Lam
Écrit il y a 3 ans
Voir plus d’évaluations
Mauricio Contri Lam
Écrit il y a 3 ans
Voir plus d’évaluations
This beginner Power BI training course is designed for professionals who need to consume content created in Power BI (applications, datasets, reports and dashboards) and shared with them. It teaches how to use the Power BI web portal, how to use the mobile application, how to analyze and interact with shared content, and how to create your own analyses based on the shared data.
- Navigate with ease and autonomy in the Power BI web portal and in the Power BI mobile app
- Analyze and interact aptly with the data that is shared with you
- Create your own analyses based on the data that is shared with you via Power BI and via Excel
BEFORE WE BEGIN
- Create an account or connect to an existing account
- Change the language of the web portal
- Getting the most out of your training
- Become familiar with the portal configuration
- Discover the apps section
- Access the apps shared with us
- Search for new apps and request access
- Search for third-party apps
- Explore content items in an app
- Discover other content items shared with us
- Browse recently viewed content items
- Browse your favorite content items
- Explore workspaces
- Discover your personal workspace
- Explore collaborative workspaces
- Sort and filter content within a section
- Search for content within a section
- Navigate through the different sections of the home page
- Navigate through the banner options at the top of the portal
- Discover the options of the collapsible filter panel
- View or modify report, page or view filters
- View or edit basic filtering, advanced filtering, and top-N options
- View or edit AND/OR clauses to perform a two-condition filter
- Use the search menu to locate fields to filter
- Reset the original filters
- Use report bookmarks
- Create and use personal bookmarks
- Understand the anatomy of a visualization
- Quickly see the list of filters applied to a visualization
- Examine a visual in focus mode
- Include or exclude data in a visualization
- Drill across a visualization
- Drill down into the data of a graph
- Extract detailed information from a data on another page (drill through)
- Interact with filters included in segment tiles
- Sorting data in a visualization
- Discovering tooltips
- Exporting data
- Display data in table format
- Add and view comments on selected tiles
- Chat in Teams about selected tiles
- Analyze the increase and decrease of values
- Analyze value distributions
- Explore data with a decomposition tree
- Use scenario settings
- Explore the new visual customization feature
- Adjust the size of the report
- Save a copy or print the page
- Subscribe to emails
- View related content and track data
- Add comments on a report and chat in Teams
- Discover the different ways to create your own reports in Power BI
- Create a report title
- Create different visualizations
- Add filters
- Save the report in your personal workspace
- Discover the different ways to create your own reports in Excel
- Create a pivot table on shared data
- Create a field hierarchy
- Add a slicer to your pivot table
- Add a linked chart to your pivot table
- Drilling into the chart and exploring the data
- Create a dashboard by pinning tiles from an existing report
- Explore the "ask questions about your data" feature
- Pin a question tile to the dashboard
- Create and manage alerts
- Get insights
- Discover the "Quick Access" and "Activity" sections of the home page
- Access notifications
- Search for content
- View your favorites
- Navigate through your apps
- Navigate through your workspaces
- Access items you've recently viewed
- Access items shared with you
- Retrieve sample reports from Microsoft
- Annotate a tile and share it with a colleague
- Refresh data
- Manage alerts
- Make comments
- Consume a Power BI report via Teams or SharePoint Online
- Retrieve and use sample applications
- Discover the organizational data available through Excel
- Access a range of additional resources
- What to remember about Power BI from an end-user perspective
This training course is offered in English.
This training is for professionals who need to consume Power BI content that has been created and shared by colleagues in their organization. These professionals will not be in charge of creating reports or dashboards for the organization but may want to create their own analysis for their own needs. Similarly, they need to become familiar with the Power BI online service and mobile app and learn how to interpret and interact with the content that is shared with them. In addition, they need to be able to share feedback with their colleagues.
This training has no prerequisites. It is intended for anyone who needs to consume content via the Power BI portal and/or mobile application.
Each learner must use a laptop and have a Power BI account with a pro license or be willing to access the free trial version, which will be presented during the training.
Course registration includes:
- A PDF document with step by step instructions to build the course report
- A series of video clips with demonstrations (one for each step)
- A reference website with additional resources
- A forum to ask questions
This training qualifies for 0.6 continuing education units (CEUs).
Coming soon.
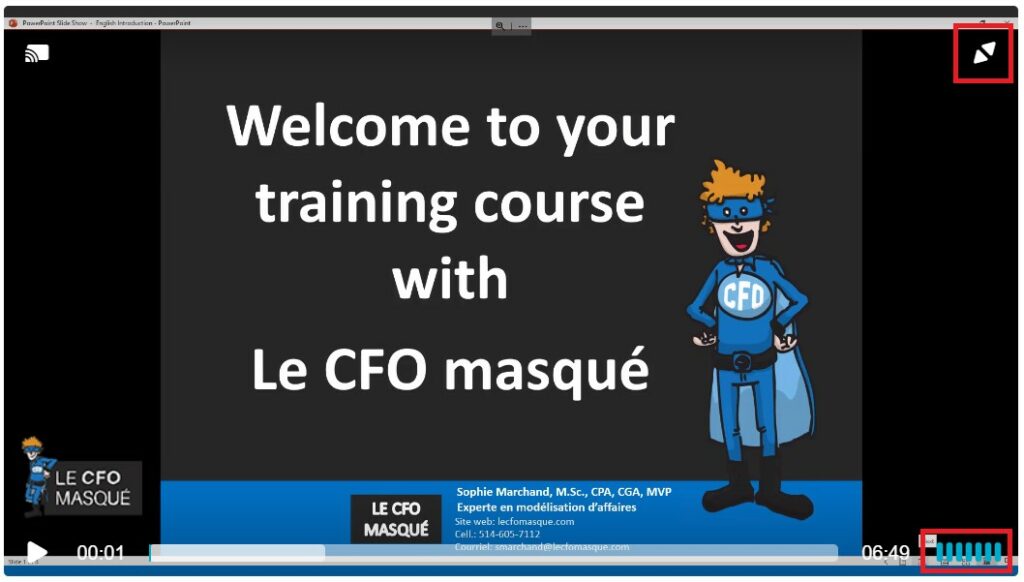
To adjust the size and volume of a video, simply use the buttons shown below.
To move to the next lesson, simply click on the name of the lesson in the bottom right corner of your screen.
If you are trying to take a course that you have already purchased and are asked to purchase it again, you are logged out. Simply log back into your account and this message will disappear.
Once you have completed all the lessons and quizzes, you will see a DOWNLOAD CERTIFICATE button appear next to the course name on the course overview page. You can then click on this button to download or print your certificate of completion.
Since you have lifetime access to your training, you can listen to the videos as many times as you like. However, your certificate will only be accessible when the course is 100% complete. Therefore, before replaying a video (which will restart the counter at 0), it is strongly recommended that you download your certificate first, in order to keep a copy of it, with the original completion date.
Your e-learning course does not come with personalized help. If you have any questions, please ask them on our online forum.
You are not allowed, in any way, to share your training documents and videos with a third party, even if it is a co-worker. This clause is part of our terms of purchase and is intended to preserve our copyright. If you enjoy the content offered by Le CFO masqué, please respect this clause. This will allow us to continue to create quality material. However, we do have an affiliate program in place. Please take advantage of this program to recommend our training to your colleagues and other contacts and we will offer you a 15% commission in return.
Votre formateur
Contenu de la formation
Évaluations et commentaires
5.0
Note moyenne
3 évaluations
5
3
4
0
3
0
2
0
1
0
Quelle a été votre expérience? Nous aimerions le savoir!
Connectez-vous pour laisser une évaluation

The training is exhaustive and very well presented.
The trainer explains topics and concepts very clearly, and every material is top-notch quality.
×
![Preview Image]()
Ceci vous a aidé?

Clear and objective content.
Video is an efficient way to attend this kind of course.
×
![Preview Image]()
Ceci vous a aidé?
Quelle a été votre expérience? Nous aimerions le savoir!
Connectez-vous pour laisser une évaluation
Very clear screen with steps to follow. The trainer has a very easy way to explain and transfer the info, it was very interesting to follow up.